Collecting metrics using application metrics and monitoring
Blue Planet provides application metrics and monitoring so you can view system metrics and monitor system activity.
Using application metrics and monitoring you can:
-
View detailed application metrics using Grafana, an open source tool used by Blue Planet software. See Managing system metrics.
-
View the health status of your system using Nagios, an open source software tool used by Blue Planet software. See Monitoring system faults or Configurable monitoring options in Blue Planet.
If you want to disable monitoring, see Disabling application metrics from bpocore.
This section includes:
Managing system metrics
Blue Planet uses Grafana to let you create and view system metrics. In this release, you receive a default Grafana dashboard. If you want more information on how to use or customize your own dashboards, see the Grafana online documentation.
-
From the Orchestration main menu, select System > System Health > Metrics.
The Grafana tool opens. You may need to log in using your admin Blue Planet Orchestration credentials.
-
To create dashboards using Grafana, see the documentation provided at http://docs.grafana.org/guides/gettingstarted.
This website link also contains basic concepts and user/reference guides.
-
From the Grafana home page, select Home > System Health Dashboard to:
-
change the hosts you are viewing by selecting the Host drop-down selector.
-
change the devices to block by selecting Block Device.
-
change the time range of the table statistics by selecting the clock icon.
-
share the dashboard by clicking the Share Dashboard icon.
-
change settings by clicking Settings.
-
Monitoring system faults
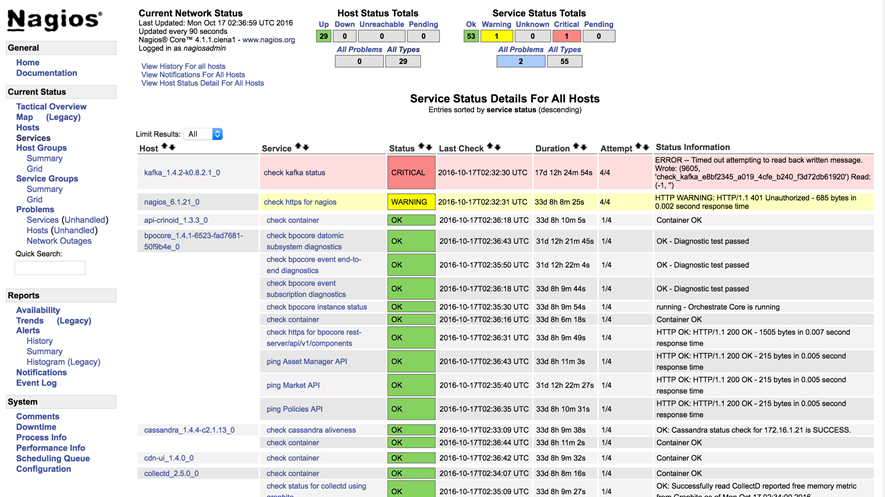
To monitor system and application faults, Blue Planet uses Nagios. Nagios checks for system faults every five minutes; hence data lag may exist between what it reports and what the system is actually experiencing.
-
From the Orchestration main menu, select System > System Health > Monitor.
You may be required to enter your authentication credentials.
-
If required, enter your user name and password.
The Nagios dashboard displays the container states and status information (see Blue Planet Nagios dashboard).
Figure 1. Blue Planet Nagios dashboard
To display container details, click the specific service in the list. Blue Planet Nagios check container view shows an example of check container service details for a Juniper resource adapter.
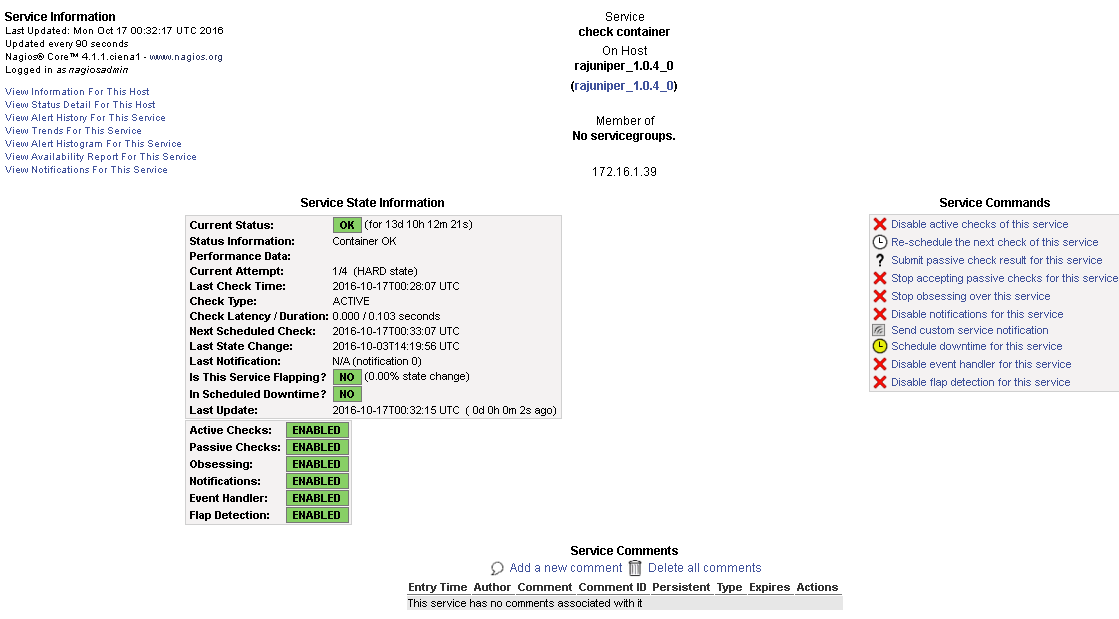
Figure 2. Blue Planet Nagios check container view
Disabling application metrics from bpocore
This section describes how to disable reporting of application metrics from the bpocore application, if desired. If you expect that the statistics reporting is part of a performance issue, this may be an option. Be aware that disabling this option removes using the statistics collected for debugging purposes.
To disable reporting of application metrics, at deployment time edit the bpocore configuration file.
To disable reporting of application metrics:
-
Create a bpocore configuration file named bpocore.conf in the bpocore container /etc/bp2/bpocore.
-
Add the following to the file:
metrics {
statsd = false
logging = false
}
This example disables StatsD, or application metrics reporting.
-
Restart the bpocore container.
-
For single host configuration use:
solution_app_restart bpdr.io.blueplanet.orchestrate:17.06.1-xx bpocore -
For multiple host configurations use:
solution_app_restart bpdr.io.blueplanet.orchestrate:ha-17.06.1-xx bpocoreSubstitute the appropriate release number as needed.
-