Troubleshooting and system maintenance logs
This section describes the following centralized logging topics:
Centralized logging overview
This section describes how Blue Planet handles the logging workflow, the components involved, and event details.
Centralized logging aggregates all log messages from various hosts to a centralized location. It consolidates all logs and provides an easy-to-use interface to access the log data.
To access the interface, see Troubleshooting using the Blue Planet logging tool.
The centralized logging workflow consists of several components:
-
Syslog—Blue Planet standard for logging messages
-
Heka—an open source stream-processing software system
-
Elasticsearch—an open source multi-tenant full-text search engine
-
Kibana—an open source data visualization plug-in for Elasticsearch
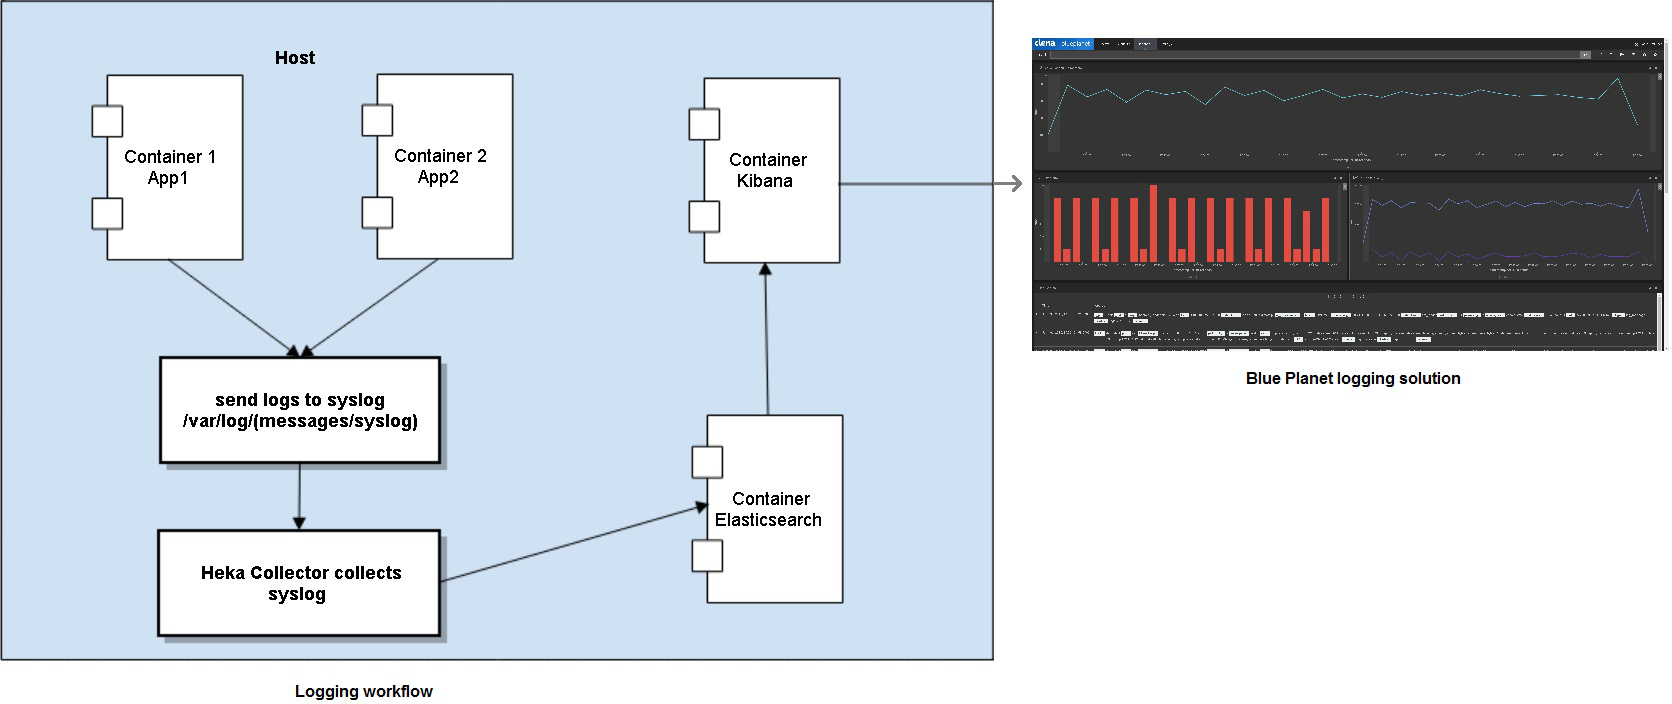
The following figure shows the workflow from applications or resources into syslog. Heka collects syslog data and sends it to Elasticsearch to display it in Kibana as the Blue Planet logging solution dashboard.
Figure 1. Centralized logging workflow
The logging tool has four components:
-
A graph of the logcount time stamp
-
A graph of the messages marked error
-
A graph that shows split priority messaging
-
A view of the recently collected messages from syslog
Important events logged into syslog
This section describes details of some of the important events logged into syslog including:
Service creation, changes, or deletions
When resources are created, updated, or deleted, Blue Planet creates a resource history event. It includes the userId that made the change, the time of the change, the attributes changed, and the type of change (initially Set and then Updated).
The following is an example of a pair of "Resource activation started" and "Resource activation successful" messages:
{
"app": "bpocore",
"app_instance": "0",
"desired_orch_state": "active",
"hop_id": "18e71800-4577-4d2d-8d61-3e89d60567ad",
"host": "bpserver",
"msg": "Resource activation started",
"msg_id": "83657f0ac34d3fa2b6cf2826af2f8618",
"namespace": "com.cyaninc.bpocore.market.instancelayer.ResourceCatalogShardActor",
"oplog": true,
"orch_state": "requested",
"priority": 6,
"product_id": "57916bc7-c97e-4d40-97b6-6c6f67fcde71",
"resource_id": "57916e3f-5938-4ca9-8411-c9149d6eccac",
"resource_tenant_id": "28b7831b-13e8-4b6b-863c-a3f53a0e47e3",
"resource_type": "example.resourceTypes.HelloWorld",
"tenant_id": "28b7831b-13e8-4b6b-863c-a3f53a0e47e3",
"thread": "bpo-cluster-akka.actor.default-dispatcher-80",
"timestamp": "2016-07-22T00:52:15.915Z",
"trace_id": "65f1a9c6-6521-4b6a-9109-16e76ffe538f",
"upstream_id": "3a79ad4b-f20a-349b-b06e-87309637fd3f",
"user_id": "676297b7-c38c-4c3e-8e77-cd2a1e591a81"
}
{
"app": "bpocore",
"app_instance": "0",
"desired_orch_state": "active",
"hop_id": "e9f0dc52-01d5-42c8-a188-f985754cc861",
"host": "bpserver",
"msg": "Resource activation successful",
"msg_id": "082cfd3c26053981899195c9a079e6bc",
"namespace": "com.cyaninc.bpocore.market.instancelayer.ResourceCatalogShardActor",
"oplog": true,
"orch_state": "active",
"priority": 6,
"product_id": "57916bc7-c97e-4d40-97b6-6c6f67fcde71",
"resource_id": "57916e3f-5938-4ca9-8411-c9149d6eccac",
"resource_tenant_id": "28b7831b-13e8-4b6b-863c-a3f53a0e47e3",
"resource_type": "example.resourceTypes.HelloWorld",
"tenant_id": "28b7831b-13e8-4b6b-863c-a3f53a0e47e3",
"thread": "bpo-cluster-akka.actor.default-dispatcher-80",
"timestamp": "2016-07-22T00:52:20.403Z",
"trace_id": "65f1a9c6-6521-4b6a-9109-16e76ffe538f",
"upstream_id": "4cf50a26-8022-404e-a382-44601120c2fa",
"user_id": "676297b7-c38c-4c3e-8e77-cd2a1e591a81"
}
Server application activity
You may need help from Ciena Customer Service if you experience issues. If you are asked to download log files to assist them with overall logging troubleshooting, you can either:
-
Download from the orchestrate interface by selecting System > System Health > Logging, then selecting More > System Troubleshooting > Download Log Pack
-
Use bpocore-cli to run bpocore log-pack download
Most application logs are aggregated into syslog. In addition, bpocore logs are separate and include:
-
bpocore.log—what goes on in bpocore
-
bpocore.error.log—subset of bpocore.log; classified as error or warning messages
-
bpocore.restserver.log—API requests coming into northbound interface (NBI)
-
bpocore.restclient.log—API requests to southbound from bpocore (for example: calls to UAC, internal RAs talking to southbound systems; it does not include external RA calls)
-
plan-log.log—one log file per imperative plan execution
Troubleshooting using logs
This section describes several ways to use the logging tool to:
-
View an operational log of resource or service activity such as activation, updates, and termination. You can search for service activation and other BP system operational event details to help you determine what events occurred on your system or in your network.
-
View and troubleshoot the operation of the system. You can use the search filters to understand if there are problems that impact resources by querying all log messages that are associated with a specific resource or query using a trace ID associated with a top-level request to find all log events associated with fulfilling that request.
For details on how to use the BP logging user interface, see:
Troubleshooting operational issues of a resource or service activation
Blue Planet creates an operational log that contains event information about activity in the system.
Basic logging information collected for resource-oriented log messages includes user data, time-stamps, and other details about the resource or service state. For debugging purposes, Blue Planet also tracks information from external resources that are involved in service activation (such as VLAN ID and Tunnel ID).
Use the following example scenarios to understand how you can filter the centralized log for more details. To understand how to use the logging tool, see Troubleshooting using the Blue Planet logging tool.
| Scenario | Procedure |
|---|---|
Something went wrong on service creation. |
Query all messages regarding a specific resource. Search based on resource_id. |
Query the history of specific resource activations through the API. |
Search based on the trace_id from the service activation request. |
Review all messages about a specific container or app. |
Use the logging tool to search for the container and app fields. |
Find all instances of a specific type of message. |
Search for message text or msg_id. For example, activation failures. |
Troubleshooting using the Blue Planet logging tool
If your administrator has installed the Blue Planet logging solution during installation, you can access the tool using the following steps. For details on how to add the solution, see Installing an optional Blue Planet solution.
-
To access the logging tool from the web browser, enter: https://<server_IP>/bplogging/. To understand the Blue Planet logging solution, see Centralized logging overview.
-
To use the dashboard tools to modify data on the dashboard:
-
To filter to a specific time, select the clock icon in the menu bar and select from the sort options:
-
Quick (a set of preconfigured options, such as 24 hours)
-
Relative (a time range of a specific time range for today to now)
-
Absolute (a start and stop date/time range)
-
-
To view or modify the log count by timestamp graph. Use this graph to get an overview of the log activity and patterns. To modify settings, select the edit pencil in the menu bar. The timestamp default is 30 seconds.
-
To view or modify log messages that contain the text error. Use this graph to watch error activity. To modify settings, select the edit pencil in the menu bar. The timestamp default is 3 hours.
-
To view or modify the various message counts by priority. Use this graph to keep track of various priority messages on one graph. To modify settings, select the edit pencil in the menu bar. The timestamp default is 3 hours.
-
To update and rediscover message data, click Auto-refresh. The data does not update real-time.
-
-
To search the message log you can:
-
For a quick search, enter your search criteria in the search bar.
-
For a detailed search, select Discover or select the pencil icon in the log_search pane to display the Discover page. Enter your query criteria in the menu bar or click add in the log pane to filter on selected fields. You can use Apache Lucene query syntax. You can also use a combination of the two to narrow your search.
-
Troubleshooting using the REST API
You can use the REST API to send queries to the Elasticsearch component. This section describes an example use case where you know that a "Resource discovered" message has a specific msg_id (displayed in the centralized logging tool).
To query all of the messages in that category, issue a REST query to the Elasticsearch app with a body that defines the query:
POST https://<server_IP>/elasticsearch/_search
Include the following headers:
"Authorization: basic <token>"
"Content-Type": "application/json"
An example of the body of this REST API query follows:
{
"query": {
"bool": {
"must": [
{ "match": { "msg_id": "65df85e0a123376b913b25dac15323a9" } }
]
}
}
}
An example response follows:
{
"took": 2,
"timed_out": false,
"_shards": {
"total": 10,
"successful": 10,
"failed": 0
},
"hits": {
"total": 44,
"max_score": 10.130918,
"hits": [
{
"_index": "logs-2016.10.29",
"_type": "log_message",
"_id": "AVWZ5bxhpqvCRa6-EqPf",
"_score": 10.130918,
"_source": {
"app": "bpocore",
"desired_orch_state": "unspecified",
"tenant_id": "bd795e4e-592f-44ca-b882-f9f50690821c",
"msg": "Resource discovered",
"thread": "bpo-cluster-akka.actor.default-dispatcher-39",
"app_instance": "2",
"resource_label": "testsubnet",
"msg_id": "65df85e0a123376b913b25dac15323a9",
"upstream_id": "3a79ad4b-f20a-349b-b06e-87309637fd3f",
"priority": 6,
"namespace": "com.cyaninc.bpocore.market.instancelayer.ResourceCatalogShardActor",
"trace_id": "3a79ad4b-f20a-349b-b06e-87309637fd3f",
"hop_id": "3a278ea8-8f55-4bcf-9a7d-a37adba57f88",
"product_id": "57732c75-ed42-45a4-92e0-3fb93d988034",
"oplog": true,
"orch_state": "active",
"resource_type": "tosca.resourceTypes.Subnet",
"host": "ip-10-206-30-151",
"resource_id": "57732c76-7518-4dde-8b54-d728fe564642",
"timestamp": "2016-06-29T02:03:37.339Z",
"resource_tenant_id": "bd795e4e-592f-44ca-b882-f9f50690821c",
"user_id": "admin"
}
},
truncated
For additional information on Elasticsearch query syntax, see the Elasticsearch website.
Troubleshooting and helpful logging information
Use the following details to understand and troubleshoot centralized logging:
-
Ensure the platform solution is running before you run the logging solution. Since logging is a complementary solution, your administrator must install it as part of the installation or upgrade process. See your specific Blue Planet installation user documentation for more details.
-
If you are in the bplogging search field and expect to see message data but only get a message “No results found” (with an icon of a unhappy smile face), you may need to widen the time range of your query. To widen your search query, select another longer time interval. Once a message containing a time stamp displays. It moves to the next interval as time progresses. You may need to use options such as last 1, 4, 12, or 24+ hours to view specific message data.
-
-
The operational logs are tagged with "oplog." BP ensures each app logs the appropriate event messages. Apps must set the oplog field in a message to true to allow for special processing and prioritization. Operational logs (also called audit logs) have additional requirements for format, content, and frequency.
-
The system logs oplogs once and only once per server transaction, except for jobs that are logged at the start of the job and upon completion. The reason behind this method is to give an itemized view of every transaction performed on a system, along with the result of the transaction (success/failure/partial success).
-
The system retains logs in the Blue Planet database for four weeks. Each week the system archives its message log and rotates the oldest of the four log files out to make room for the latest archive of messages.
-
Syslog contains most, but not all logs. Some logs are not aggregated in this location to ensure the syslog is not cluttered with conversational or overly detailed messages. For example, RAs record all endpoint conversations to local storage. Since this data tends to be large, it is not sent to syslog. For details about the bpocore logs, see Server application activity.
-
In addition to logging, the bpocore Market APIs allows you to query the history of a resource. For details review the API integrated within the product in the System > Documentation product menu.