htpasswd htpasswd.users nagiosadmin
Configurable monitoring options in Blue Planet
There are several configurable options available to the admin user in Blue Planet orchestration software. These include tasks related to metrics and monitoring using the Nagios and Grafana tools.
|
|
Grafana and Nagios are for the admin user only; therefore support only the default admin user account. Additional account creation is not supported in this release. |
This section includes information and procedures for the following topics:
About Nagios and Grafana tools
Nagios is an open source tool that monitors Blue Planet system performance.
Blue Planet Nagios works out of the box and is used mainly by BP administrators, not users. No changes to the default settings are required when deployed in Blue Planet Orchestration. This ensures that Nagios is easy to use and avoids coding issues that can arise. Use caution when altering Nagios settings, because any changes not described in this guide are not supported.
Grafana is an open source tool used to view metrics collected by Blue Planet Orchestration. In this release, you receive a default Grafana dashboard. If you want more information on how to use or customize your dashboard, see the Grafana online documentation.
Changing the default nagiosadmin password
After Blue Planet is installed and Nagios is activated, Ciena recommends you change the default nagiosadmin password.
The password for the admin user in these two tools defaults to adminpw can be changed. It is not tied to the admin user in the Blue Planet Orchestrate UI.
To change the nagiosadmin password:
-
In the /etc/bp2/nagios directory, enter:
-
Enter the new password.
-
Confirm the new password.
The system updates the password for user nagiosadmin. You do not need to push any configuration changes.
Changing the default Grafana password
|
|
The password for the Grafana admin user defaults to adminpw. It is not tied to the admin user in the Blue Planet Orchestrate UI. |
To change the default Grafana password:
-
From the main menu, select System > System Health > Metrics.
The Grafana tool opens.
-
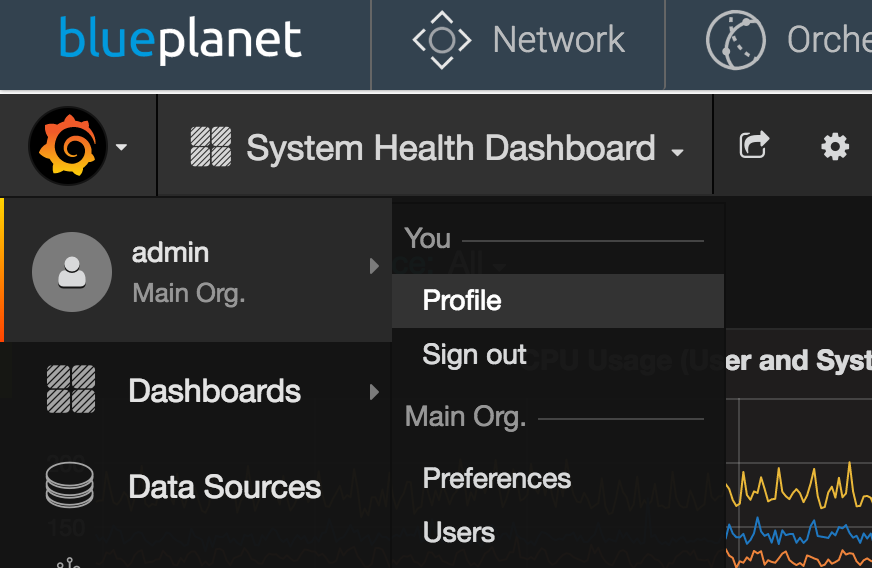
Click the Grafana icon at the top left of the screen and select admin > Profile.
-
In the Profile screen, click Change Password.
-
Enter the old password and the new password in the provided fields.
-
Click Change Password to save the new password.
A message displays about your new password.
-
Log out and log in again to verify that the password change is in effect.
Configuring SNMP notifications in Nagios
Nagios can send SNMP traps to other management hosts. By default, this feature is disabled on Blue Planet Nagios. Use this procedure to enable and configure Nagios SNMP notifications to your external host.
-
Enable SNMP notifications in the contacts.cfg file.
When Nagios boots up for the first time, default Nagios configuration files are deployed to /etc/bp2/nagios.
If you accidentally misconfigure these configuration files or need to restore the default files, you can delete the current file and restart Nagios. After Nagios restarts, if the file does not exist, Nagios restores the default file. -
To enable SNMP to send service trap notifications in contacts.cfg, change to the /etc/bp2/nagios/objects directory and edit the file as follows:
cd /etc/bp2/nagios/objects
vi contacts.cfg
-
Edit the original file to uncomment the send-service-trap and send-host-trap commands as documented below in the "updated file content". The original file content is provided for your information. Nagios uses semicolons
;to comment unnecessary commands.Original file content (around line 38)
;service_notification_commands   notify-service-by-email,send-service-trap
;host_notification_commands      notify-host-by-email,send-host-trap
service_notification_commands    notify-service-by-email
host_notification_commands       notify-host-by-email
Updated file content after revisions are complete
service_notification_commands   notify-service-by-email,send-service-trap
host_notification_commands      notify-host-by-email,send-host-trap
;service_notification_commands  notify-service-by-email
;host_notification_commands     notify-host-by-email
-
-
Set the IP address of your trap receiver in the commands.cfg file.
-
Enter:
cd /etc/bp2/nagios/objects
vi commands.cfg
-
Change the default IP address to your trap receiver IP as follows:
Around line 39
In the following example, the trap receiver address IP is
10.15.2.178:define command{ command_name send-service-trap command_line /usr/local/bin/send-service-trap 10.15.2.178 public "$HOSTNAME$" "$SERVICEDESC$" $SERVICESTATEID$ "$SERVICEOUTPUT$" } # 'send-host-trap' command definition define command{ command_name send-host-trap command_line /usr/local/bin/send-host-trap 10.15.2.178 public "$HOSTNAME$" $HOSTSTATEID$ "$HOSTOUTPUT$" }
-
-
If you have a cluster environment, propagate the Blue Planet configuration files to the other servers.
root@localhost:~# bp2-site sync-site-config
-
Restart the Nagios app. Depending on the solution you use, you can restart Nagios in
solman. The following example restarts the orchestrate solution:(Cmd) solution_app_restart bpdr.io.blueplanet.orchestrate:17.02.1-25 nagios
-
On the trap receiver side, import the Nagios MIBs into your trap receiver. The Nagios MIBs used by Blue Planet are located on the host server in
/etc/bp2/nagios/mibs.The configuration process is complete.
-
(Optional) To send notifications to more than one trap receiver, do the following:
-
Add additional entries to the commands.cfg and contacts.cfg files.
Replace the sample IP addresses, 1.1.1.1 and 2.2.2.2, with your trap receiver IP address. # 'send-service-trap' command definition define command{ command_name send-service-trap command_line /usr/local/bin/send-service-trap 1.1.1.1 public "$HOSTNAME$" "$SERVICEDESC$" $SERVICESTATEID$ "$SERVICEOUTPUT$" } # 'send-host-trap' command definition define command{ command_name send-host-trap command_line /usr/local/bin/send-host-trap 1.1.1.1 public "$HOSTNAME$" $HOSTSTATEID$ "$HOSTOUTPUT$" } # 'send-service-trap2' command definition define command{ command_name send-service-trap2 command_line /usr/local/bin/send-service-trap 2.2.2.2 public "$HOSTNAME$" "$SERVICEDESC$" $SERVICESTATEID$ "$SERVICEOUTPUT$" } # 'send-host-trap2' command definition define command{ command_name send-host-trap2 command_line /usr/local/bin/send-host-trap 2.2.2.2 public "$HOSTNAME$" $HOSTSTATEID$ "$HOSTOUTPUT$" } -
Update the contacts.cfg file to send to the new commands.
service_notification_commands   notify-service-by-email,send-service-trap,send-service-trap2
host_notification_commands      notify-host-by-email,send-host-trap,send-host-trap2
;service_notification_commands  notify-service-by-email
;host_notification_commands     notify-host-by-email
-
Synchronize site data and restart the Nagios app.
root@localhost:~# bp2-site sync-site-config

root@localhost:~# solman
(Cmd) solution_app_restart bpdr.io.blueplanet.orchestrate:17.02.1-25 nagios
-
Sending URL NBI checks to Nagios
This topic is for developer use only.
Micro-services can register with Nagios to check the availability of HTTP or HTTPs URLs. Nagios returns any HTTP error codes in its status information. To register micro-service checks, you publish a northbound interface (NBI) of type nagioscheck.
To allow Nagios to perform the check, you must provide specific data including the URL and a description. Nagios then performs an HTTP GET against the URL periodically. Micro-services return a status of 200 OK along with a string with additional details when the URL is reachable. If there is a problem, the micro-service returns a status of 500 with a detailed error message in the body.
For details on app requirements, see the following NBI nagioscheck fields table and the URL NBI Nagios checks example code example. Checks must be in a python dictionary or equivalent format.
| Required fields | Description | Required attributes | NBI command options |
|---|---|---|---|
|
Container IP address, use the environment variable |
||
|
Must be |
||
|
A list of checks |
|
Choose one:
|
|
|||
|
URL NBI Nagios checks example
import os
from bp2hookutil import hookresponse


def publish_nagios_checks():

Publish nagios checks

data = {
'ip': os.environ.get('BP_HOOK_CONTAINER_IP', ''),
'type': 'nagioscheck',
'checks': [
{'command': 'check_https_haproxy',
'args': '/thirdpartycheck/',
'description': 'check login'
},
{'command': 'check_https_haproxy',
'args': '/thirdpartycheck/api/v2/ping',
'description': 'check ping response'
},
{'command': 'check_http',
'args': '-u /thirdpartycheck/api/v2/checksomething -p 5000',
'description': 'check response on port 5000'
}
]
}

hookresponse.interface_join('nagiosalert', data)

if __name__ == '__main__':

publish_nagios_checks()